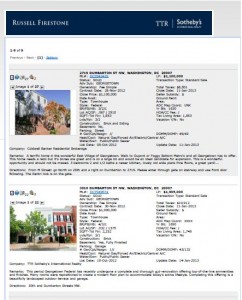
 In the month of January, there were 9 sales in Georgetown with an average sale price of $2,094,056 with a total sales volume of $18,846,500.00. All sales data provided by MRIS. This is the link to the PDF list of properties that were sold in Georgetown in January: January Real Estate Report
Georgetown Sales Report – January 2013
Georgetown Real Estate Report – November 2012
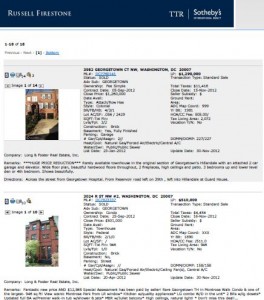 In the month of November, there were 18 sales in Georgetown with an average sale price of $1,469,195 with a total sales volume of $26,445,500.00. All sales data provided by MRIS.
This is the link to the PDF list of properties that were sold in Georgetown in November: November Georgetown Sales Report
Georgetown Real Estate Report – October 2012
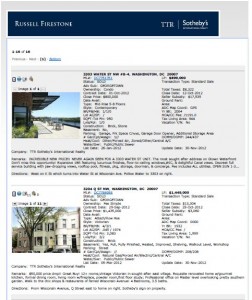 In the month of October, there were 16 sales in Georgetown with an average sale price of $966,188 with a total sales volume of $15,459,000.00. All sales data provided by MRIS.
This is the link to the PDF list of properties that were sold in Georgetown in October: October Georgetown Sales Report
Georgetown Real Estate Report – September 2012
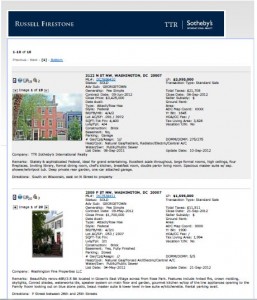 In the month of September, there were 10 sales in Georgetown with an average sale price of $1,158,900 with a total sales volume of $11,589,000.00. All sales data provided by MRIS.
This is the link to the PDF list of properties that were sold in Georgetown in September: September Georgetown Sales Report
Georgetown Real Estate Report – August 2012
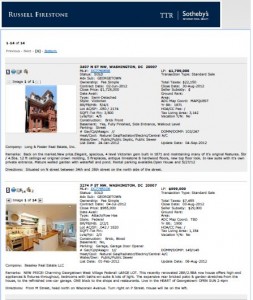 In the month of August, there were 14 sales in Georgetown with an average sale price of $1,058,501 with a total sales volume of $14,819,010.00. All sales volume provided by MRIS.
This is the link to the PDF list of properties that were sold in Georgetown in August: August Georgetown Sales Report
Georgetown Real Estate Report – July 2012
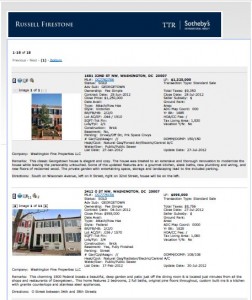 In the month of July, there were 18 sales in Georgetown with an average sale price of $1,233,497 with a total sales volume of $22,202,940.00. All sales data provided by MRIS.
This is the link to the PDF list of properties that were sold in Georgetown in July: July Georgetown Sales Report
Georgetown Real Estate Report – June 2012
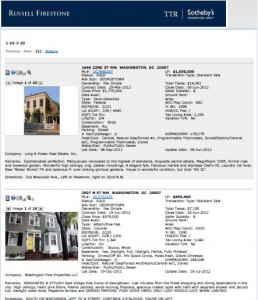 In the month of June, there were 23 sales in Georgetown with an average sales price of $1,030,772 with a total sales volume $23,707,750.00. All sales data provided by MRIS.
This is the link to the PDF list of properties that were sold in Georgetown in June: June Georgetown Sales Report
Georgetown Real Estate Report- May 2012
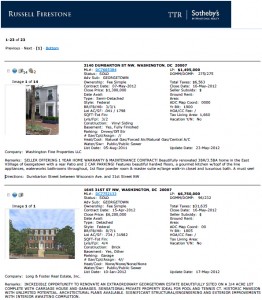 In the month of May, there were 23 sales in Georgetown with an average sale price of $1,699,826 with a total sales volume of $39,096,000. All sales data provided by MRIS.
This is the link to the PDF list of properties that were sold in Georgetown in May: May Georgetown Sales Report
DC Area List Prices Increase Year Over Year
List prices in the Washington DC Metropolitan region have a median gain of 9.76% year over year according to the National Association of Realtors. The DC metro area list price increase is the fourth highest in the nation so far this year compared to last year. The list price increase is due to many factors but most importantly low inventory. According to MRIS, the inventory in DC is 1.96 months before a property goes under contract on average.
This is the link to the full NAR report.
DC Area List Prices Rise Month Over Month
The DC metro area list prices rose month over month by 5.92% making it the number two area in the country for rising list prices. San Francisco is number one by less than .02%.
This is the link to the article in Realtor Magazine:
7 Metros Where List Prices Soared Last Month | Realtor Magazine.
